Plotting two different time series on the same line graph in Tableau
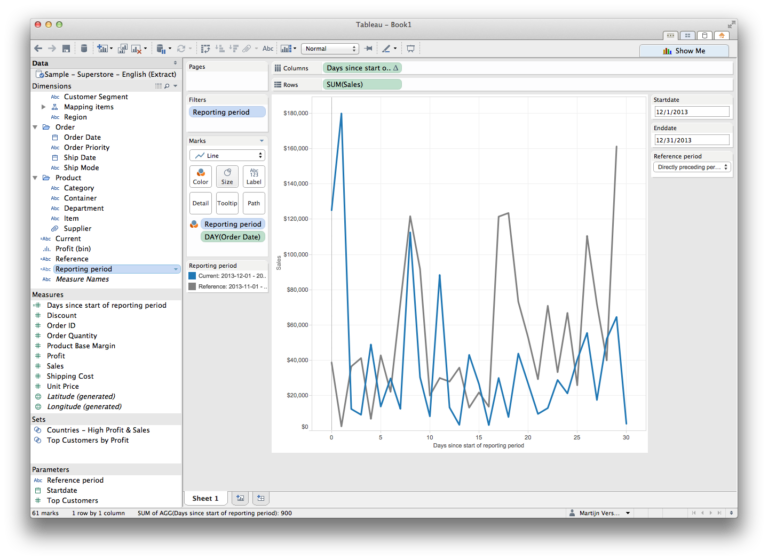
Update: I’ve written a new article that makes it easier to plot two time series in the same graph. Tableau is a great and easy to use data visualization tool, allowing you to create beautiful and meaningful visualizations within minutes. From time to time I run into visualizations that are harder to implement in Tableau. Comparing … Meer lezen over Plotting two different time series on the same line graph in Tableau
86 reacties